Quick Summary With reference to details listed on the rest of this weeks reflection, please view the following points for a general outline of some of the most prevalent differences and similarities between the climate of Palm Desert, California and Milan, Italy;
Temperature Differences and Urban Heat Island Effect Similarities The Subtropical - Arid climate of Palm Desert, California draws an average annual high temperature of 95 °F (35 °C) and an average annual low of 60 °F (16 °C). Palm desert experiences sunshine for most of the year with clear skies due to the high pressure and stable descending air of the climate. Milan, Italy falls into the Mediterranean & Temperate climate zone where mild temperatures with plenty of fog and and a good rain supply govern throughout the land. Milan’s Mediterranean climate zones is largely associated with five large subtropical high pressure cells of the oceans which include the Azores High, the South Atlantic High and the Indian Ocean high.Urban Heat Island effects of busy urban areas where the buildings, concrete, asphalt, and the human and industrial activity of the areas cause cities to maintain higher temperatures than their surrounding countryside are seen in both locations although in different levels.Palm Desert’s population of 48,445 making for about 1,793 people per square mile and Milan’s population of 1,334,077 (19,010 / sq. mi.) are great contributors to this effect.
IMILAN13 vs. KCAPALMD17 Just a quick look at Milan’s weather station (IMILAN13) in contrast with Palm Desert’s weather station (KCAPALMD17) for the winter month of January 1st year 2011, suggests some of the vivid differences between both locations.
|
Comparisons (Precipitation / Rainfall) Like all deserts, Palm Desert, CA is prone to receiving very little precipitation
and on average Milan receives about 32.3 more inches of annual rainfall than
Palm Desert. January is the month with the most precipitation with an average
of 0.6 inches. In Milan, with an average of 5.2 inches, May is the month with
the most year to year precipitation. Please notice the blue bars in the graph below
indicating the Average Precipitation in Palm Desert, CA for year 2010 and
compare that to the averages for Milan in year 2009. Note that 1 millimeter equals
about 0.04 inches so 132mm is about 5.19 inch of rainfall for May in Milan. 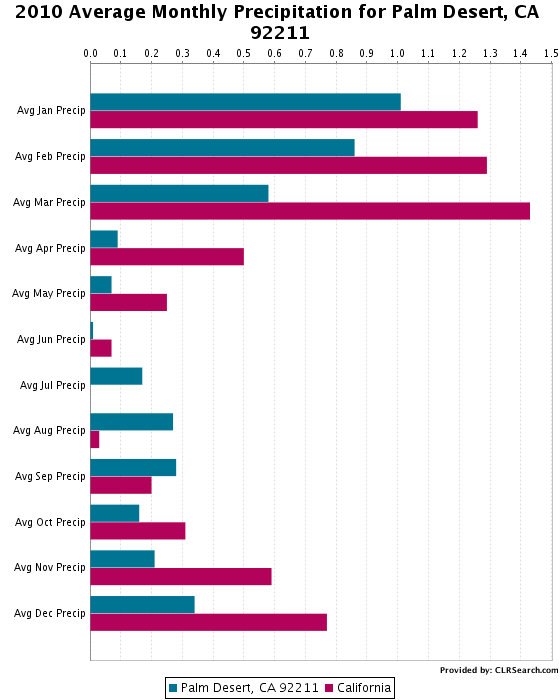 
Works Cited: Please click on each image to be directed to the site from which they have been gathered
Climate Averages for Milan - http://www.holiday-weather.com/milan/averages/#avg_rainfall Palm Desert, CA statistics - http://en.wikipedia.org/wiki/Palm_Desert,_California#Climate Compared blog location - http://palmdesertwx.tumblr.com/ Animation of chart comparing the Average High of both locations –http://www.weather.com/outlook/travel/vacationplanner/compare/results?from=vac_compare&clocid1=ITXX0042&clocid2=USCA0827 Animation of chart comparing Average Low of both locations -http://www.weather.com/outlook/travel/vacationplanner/compare/results?from=vac_compare&clocid1=ITXX0042&clocid2=USCA0827 Animation of chart comparing Average Precipitation of both locations - http://www.weather.com/outlook/travel/vacationplanner/compare/results?from=vac_compare&clocid1=ITXX0042&clocid2=USCA0827 |