~ Air Masses - Fronts - Cyclones - Local Topographic Influences ~

Maritime Arctic (mA) & Maritime Polar (mP):

    The influence of an open ocean which extends between Europe and North America allows for an inflow of Maritime Arctic Air and Maritime Polar Air to reach Milan. Because of their moisture content and instability, cumulus and cumulonimbus clouds are typical of this air mass.

Continental Arctic (cA) and Continental Polar (cP) in the Winter:

    On occasion, cA and cP air masses can be observed over Milan coming from the region of northern Russia, Finland and Lapland. Because of the dryness of cA and cP air, clouds are usually absent over the area. Once the cA and the cP air masses flow past Italy in the south-west direction over the Mediterranean, the air soon becomes unstable and gives rise to cumulus and cumulonimbus clouds with showers.


Local Topographic / Geomorphology Influences (Alps and Apennines)

     With reference to the two maps below, one can see that Milan sits just 30 miles south of the Alps. The trajectory of this extensive mountain range spreading from east to west across southern Europe adds to the mA and mP air conditions of the region. With Italy’s mainland being generally mountainous with the spread of Apennines and the first reliefs of the Alps located in Milan, the Maritime Arctic and Polar Air Masses can be observed.  

    The following is an RGB Composite Time lapse video of Air Masses traveling over Europe (Including Milan, Italy) In the time between January 1st and April 30th of this year (2011). This type of infrared senses radiant (heat) energy given off by the clouds. The warmer (lowest to the atmosphere) the clouds are, the whiter they appear. Coldest (highest) clouds are displayed in shades of yellow, red and purple.

    Note that Milan has less fluctuations of white clouds over it than areas that are closer to the North Sea and Atlantic Ocean. The lack of warm clouds flowing through the atmosphere accounts for some of Milan's dry air which in turn influences the dramatic climatic variations throughout the seasons.  

Work Cited:

Please click on the images in order to be redirected to the sources from which each image was gathered from.

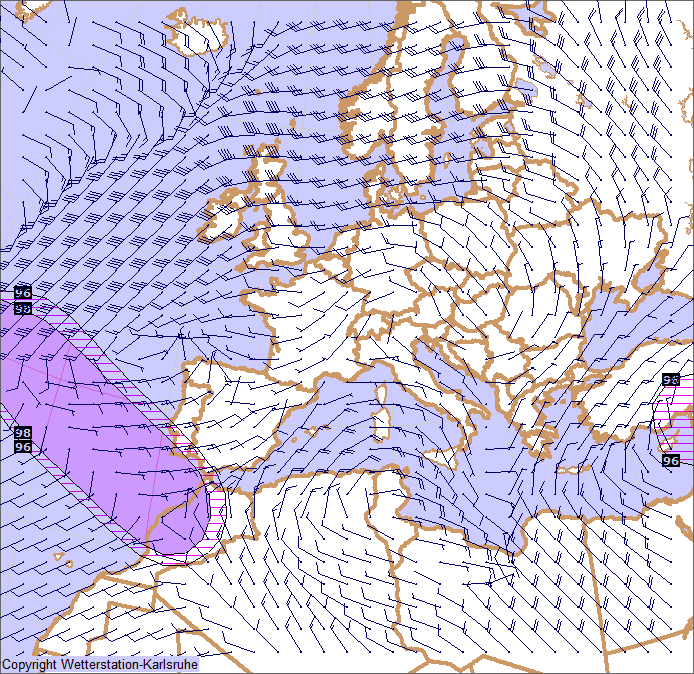
Weather Map / Boyden Index : http://www.wetterstation-karlsruhe.de/Wetter/Wetterkarten/wetterkarten.html

Milan Exact location: http://www.google.com/imgres?q=exact+location+of+milan&um=1&hl=en&sa=N&biw=1280&bih=522&tbm=isch&tbnid=L_AH7A0LyXPtZM:&imgrefurl=http://www.pickatrail.com/jupiter/location/europe/italy/milan.html&docid=pGqNfuTRAtXOEM&imgurl=http://www.pickatrail.com/jupiter/location/europe/italy/map/milan.gif&w=432&h=515&ei=kLetTpaNOufQiALIq_meCw&zoom=1

Other maps: http://www.hoeckmann.de/karten/europa/italien/index-en.htm

Milan and the alps: http://goitaly.about.com/od/moreitaliancities/p/milan.htm

Sirocco Winds: http://en.wikipedia.org/wiki/Sirocco

Infrared: http://www.theweathernetwork.com/static/satradarmaps/popup_en.htm


Weather Pressure to Air Flow Pattern

    The following map shows the current (October 30th, 2011) areas of high (H) and low (T) air pressure with reference to the direction and strength of the air flow throughout Europe. Notice that the strength of air flow traveling through Milan, Italy is at 20 making for a low (T) air pressure across the area.

Wind over Europe (Non-Topographically Influenced)

    The map below shows the so-called generalized wind climate over Europe (aka ‘Wind Atlas’). In such a map, the influences of local topography have been removed and only the variations on the large scale are shown.

Sirocco Winds / Thunderstorms

A sirocco wind is a Mediterranean wind that comes from the Sahara and reaches hurricane speeds in North Africa and Southern Europe. Warm, dry, tropical air masses that are pulled northward from the Arabian or Sarah deserts reach Milan, Italy mainly in the spring, bringing quite high temperatures and frequent thunderstorms closer to the Italian Alps. Something that helps to measure the probability of these thunderstorms is called the Boyden Index. The map below shows an example of this index in action. To calculate the height difference (Z) is required between the height of an air pressure of 700 hPa and the height at 1000 hPa and the temperature (T) at the height of 700 hPa. The larger the value, the higher the probability for thunderstorm formation. From a BI of 84, a thunderstorm is likely.          


Make a Free Website with Yola.